After the first week’s video blog, Bill Fontana started exploring the CERN laboratory in many different ways. Armed with his accelerometers, which are used by structural engineers traditionally to measure the movement of structures and his recording equipment, he revealed the inner sound worlds of dipoles, the CERN grid in the computer centre and even electric pylons. As Bill said in his opening lecture of his residency at CERN, there is music in all things.
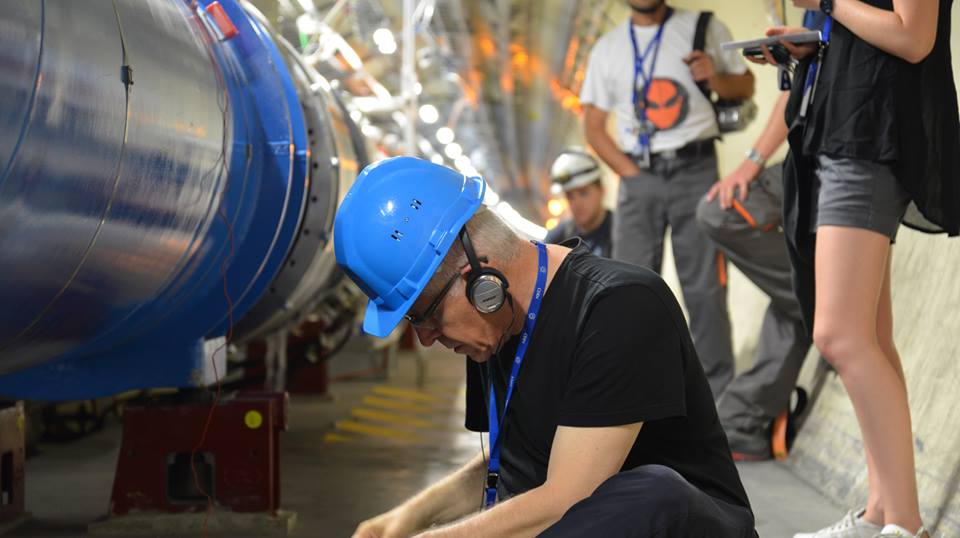
But the highlight in the first week was the first of four visits down into the Large Hadron Collider at one of the many points on the 27kilometer ring. Bill’s project called acoustic time travel started going into other dimensions with this visit, as he started thinking about the possibilities the mighty machine gave him.
One tantalizing possibility was the helium pipe which runs alongside the magnets as well as the magnets and the beamlines themselves. But also the possibilities of the tunnel itself.
It is notable also that the Collide@CERN programme also gives not only the artists but also the CERN inspiration scientists access to places on the site which they never ordinarily get to see. This shows how the arts can reach parts which science alone can’t reach! So during the curated 4 weeks of Bill’s first of his residency, Subodh Patil went places he never ordinarily goes, including becoming immersed in the CERN Data Centre which is the heart of the data collection of the LHC.
Experiments at CERN generate colossal amounts of data. The Data Centre stores it, and sends it around the world for analysis
Approximately 600 million times per second, particles collide within the Large Hadron Collider (LHC). Each collision generates particles that often decay in complex ways into even more particles. Electronic circuits record the passage of each particle through a detector as a series of electronic signals, and send the data to the CERN Data Centre (DC) for digital reconstruction. The digitized summary is recorded as a “collision event”. Physicists must sift through the 15 petabytes or so of data produced annually to determine if the collisions have thrown up any interesting physics
But more surprises are to come in the Collide@CERN visits the following week. Watch out for more photographs next week in Video Blog Week 3. We discovered some really unexpected nooks and cranies, including a machine above ground which is made up of parts from other pieces of equipment dating from the 60s up until the present day and from many different parts of the world.
http://arts.web.cern.ch
https://ars.electronica.art/prix/de/collide/