
“Poking Florian” made an impact at the 2013 Ars Electronica Festival as part of the TOTAL RECALL – The Evolution of Memory theme exhibition by cleverly bridging the gap between artistry and practical usage in everyday life. Now, Alexander Köhn of Fraunhofer MEVIS explains why this installation is also of significance for the future of medicine.
So, we’re standing here in front of “Poking Florian.” Please explain to us what we see here!
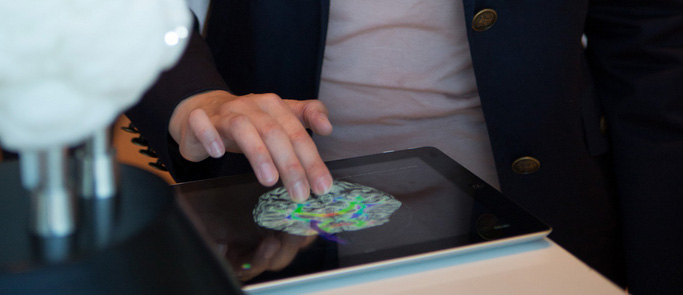
What we see are two components. On one hand, we have a brain scan made by MRI equipment, printed out by a 3-D printer and enhanced with touch-sensitive, light-emitting sensors. This exhibit is connected via Bluetooth technology to an iPad, on which installation visitors can view and explore previously rendered 2-D and 3-D images of the brain, and the connection is established via the sensors. When an installation visitor touches the sensors, the view displayed by the tablet adjusts accordingly in the form of visible fiber tracts. The sensors have been applied to certain areas of the brain that represent particular functions that are carried out in that region—for instance, motion or speech processing.
So that means you can move around the brain from one functional region to another.
Precisely. You can interactively grasp what each area is responsible for, because it’s displayed on the tablet, which also provides additional explanatory information.
Is this a scan of a living person’s brain?
In fact, that’s our colleague Florian. Several processing steps were necessary to bring the whole thing to life. First, we at Fraunhofer MEVIS set up a development platform we use to prepare the data. What we initially receive are MRI data, which we have to process for several applications—for example, for the 3-D printer. Then, we have to insert the sensor channels into which we integrate the technology. The whole brain sits upon a pedestal that houses the electronics. The basis of the whole setup is an Arduino board with a Bluetooth shield—a guy by the name of Michael Kroll was nice enough to make a beta version available to us—because we saw this as the simplest means of connecting the brain to the iPad.
The second production step was to create a high-quality rendering of the data, since the iPad isn’t capable of generating such a high-quality depiction in real time due to the fact that these are extremely high-definition data sets.
The total volume of the imaging data is 12 GB. Installation visitors can navigate via multi-touch interaction on the iPads.

What sort of data can you see on the iPad?
First off, you see the 3-D data that enables you to peer inside the brain and observe the fiber tracts, which are the result of a second data set, diffusion tensor imaging (DTI) data. What can be derived from this is the movement of water molecules along the axons of the neurons, which makes it possible to reconstruct the paths of the axons.
It takes quite elaborate processing to make these fiber tracts visible and to reconstruct where they’re located in the brain.
This is also one of Fraunhofer MEVIS’ areas of exceptional proficiency. In addition to extracting and reconstructing data—information from MRIs and other medical imaging procedures—we do biophysical modeling and simulations as well as fusion of imaging data.
In this case, the colored data set is merged with the MRI data set—so, actually, these are two separate data sets that installation visitors see simultaneously.
What is the function of the fiber tracts?
They have various functions. The brain’s surface—the so-called cortex—features neuronal networks that perform computations, as it were. They are interconnected—with each other and with other networks—but, of course, with the spinal cord as well to send and receive signals to and from the body.
There are many different networks and regions of the brain, all of which perform different tasks. Accordingly, we decided to select just a few examples for illustration purposes.
The upper middle part of the brain, for example, is the functional area that controls the legs. This region generates the signals that tell the legs what to do. Moreover, this cortex is also activated when a person watches other people walking.
In addition to motion, we have opted for production & comprehension of speech. And as our third example, we have the sight channels that take the visual signals delivered by the eyes and forward them to the visual cortex for further processing.
How is this form of depiction implemented in actual practice?
First of all, I should point out that the data itself—what’s actually seen on the iPad (where it’s presented in an aesthetic way appropriate to a work of art) is actually used in neurosurgery to plan operative procedures. The data required for this includes this fiber tract information, since the surgical team needs to know how a growing tumor has displaced the adjacent tissue and fiber tracts in order to avoid damaging them during the subsequent operation.
The 3-D mock-up of the brain is an enhancement, a translation into real-world dimensions. This haptic element can be useful for training purposes in order to get across concepts more effectively.
In 5 or 10 years when 3-D printing has progressed further, will surgeons be able to print out a brain in order to rehearse before a neurosurgical procedure?
This is actually a real possibility to get acquainted with the anatomy and be better prepared, one that’s already being used in operations on the liver, for instance, though not yet on a routine basis. Here, you can see that the surface of the brain is like a fingerprint in that every individual’s indentations and whorls are unique, and this provides the surgeon with an excellent possibility to get oriented.
Check out the following link for another example of an iPad-App aiding the planing of operations. http://blogs.reuters.com/photographers-blog/2013/08/20/inside-the-isurgery-operation/