“Calculating Empires” traces the entwining of technology and power over five centuries, showing how colonialism, militarization, automation, and enclosure operate today and might be unwound.
The S+T+ARTS (Science + Technology + Arts) initiative, led by the European Commission, promotes collaboration between artists, scientists, and technologists to foster creative and technological advancements that contribute to economic and social innovation. The Grand Prize – Artistic Exploration honors artistic works and approaches that offer new perspectives on technology and its applications, often challenging conventional thinking and opening up new avenues for technological development. These projects typically explore how artistic practices can inform and inspire new technologies, providing fresh insights and addressing complex societal challenges.
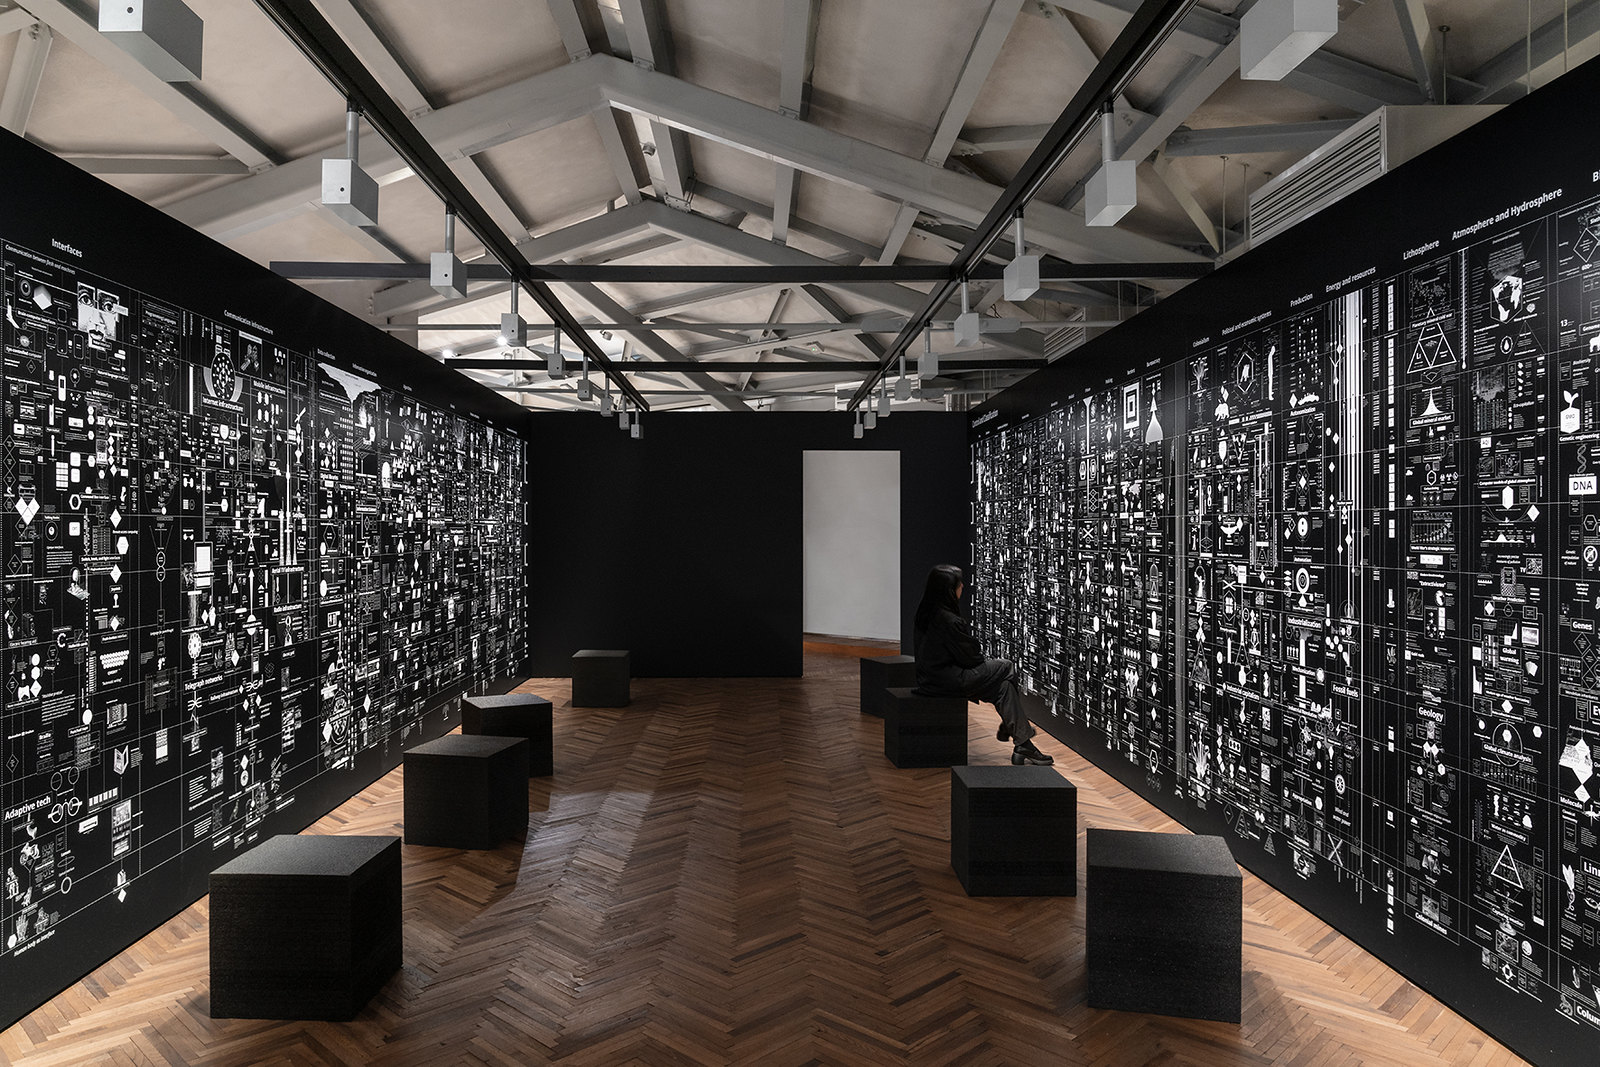
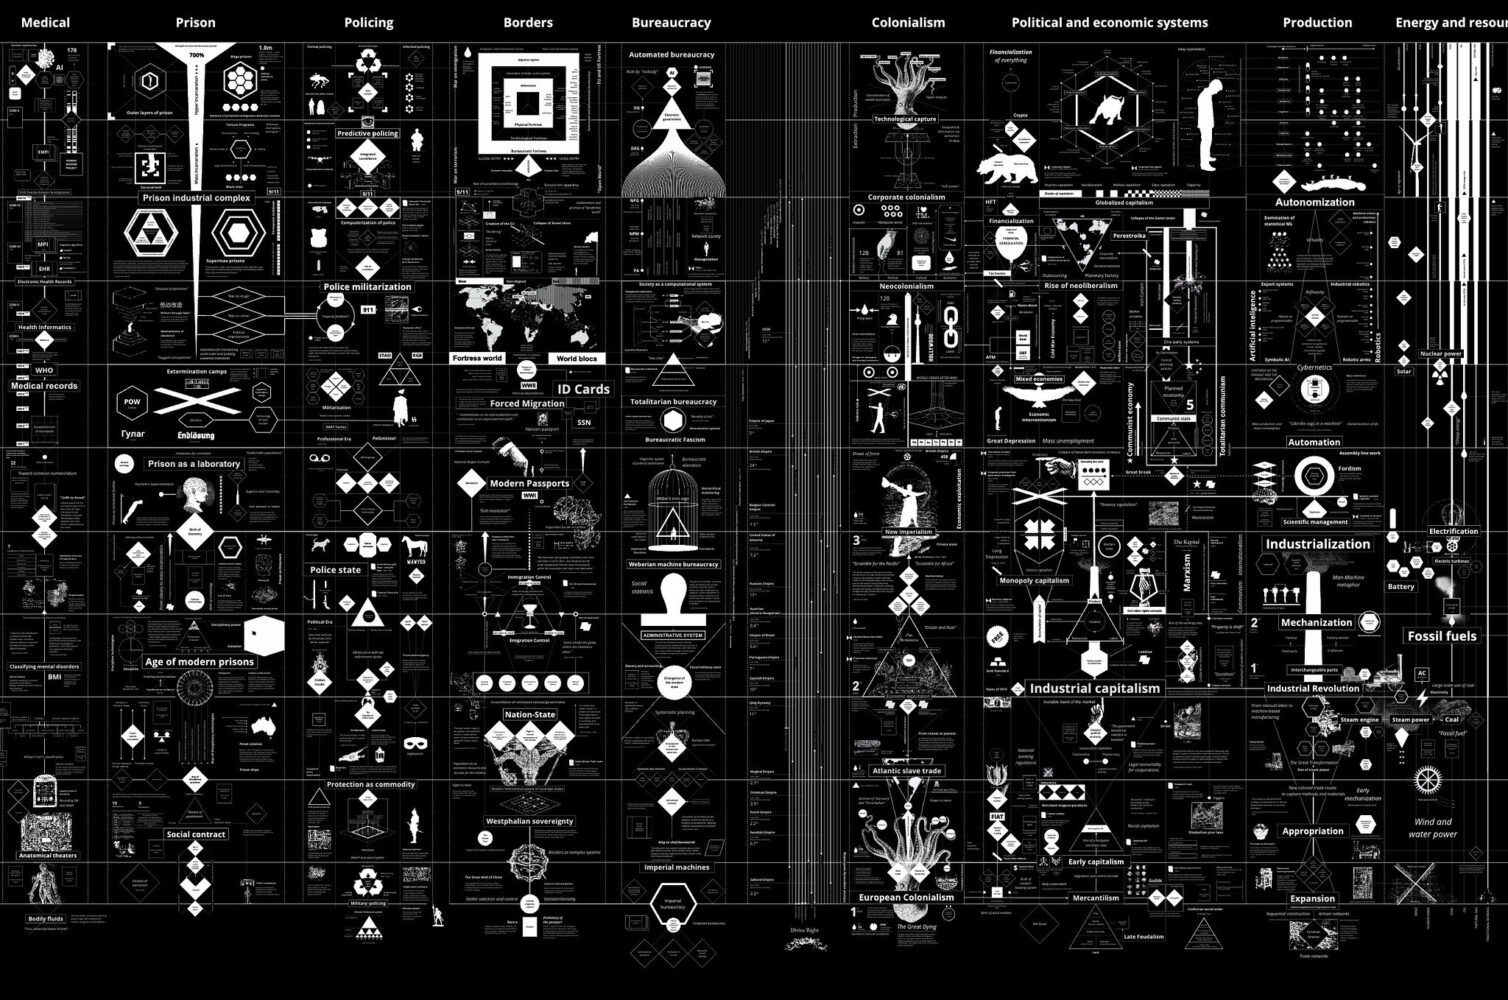
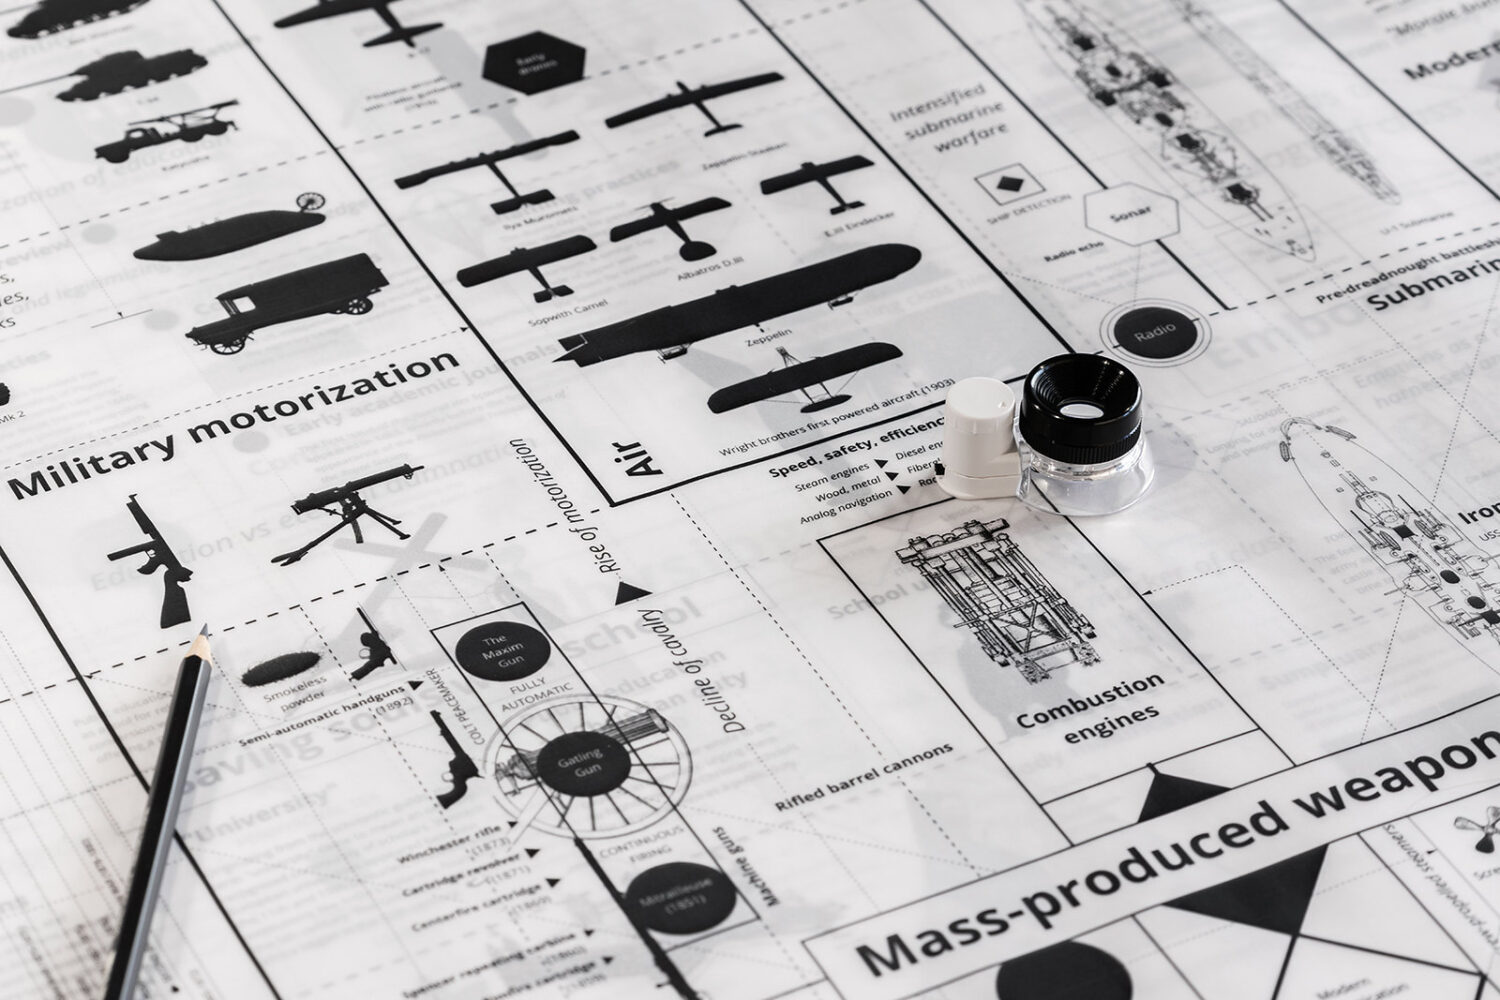
This year the Grand Prize – Artistic Exploration goes to “Calculating Empires” by Kate Crawford and Vladan Joler, a large-scale installation exploring the entwined history of technology and power over five centuries. It traces industrialization, imperialism, and automation, highlighting how empires used technology to centralize power. This project, spanning twenty-four meters and featuring detailed diagrams, premiered at Fondazione Prada in Milan and KW Institute in Berlin. It aims to provide a historical perspective on contemporary technological challenges like AI, climate crisis, and warfare. In our interview with the artists we find out more about the deep historical roots of contemporary technology and power structures and the impact of visual narratives.
How does “Calculating Empires” build upon your previous work, “Anatomy of an AI System”?
Kate Crawford: Like our previous work, Calculating Empires gives audiences a highly detailed visual narrative about the relationship between humans and technology. Anatomy of an AI System was about space – depicting the planetary demands of a single Amazon Echo device; Calculating Empires is about time: using the timescale of centuries to see how our systems of communication, classification, computation and control co-evolved. We see this kind of context as a necessary corrective to the current short-termism in technology discourse and visualization, which is frequently focused on the most recent spectacles and devices, rather than tracking the deeper historical and political context.
Above all, we consider our work a form of critical cartography. Maps are one of the oldest forms of human communication, as mediators between the inner and outer worlds, and as a genre that unites scientific and artistic interpretations of reality. We are inspired by the long tradition of critical mapping that is informed by political theory, that reveals structural power relations that are often obscured or unspoken. Michel Foucault’s method of genealogy is a significant influence here, what he called a “history of the present” – tracing the discourses and systems of power of the past in order to understand how those processes have led to the current moment.
What methodologies did you use to gather and interpret the historical data and information visualized in the installation?
Vladan Joler: Calculating Empires is a result of four years of research and visualization. In this process we were using methods of critical cartography and visual storytelling to guide us through the investigation process. It’s a progression of the methodologies we used in Anatomy of an AI System, where we mixed several different investigation techniques, from patent investigations, to cyber forensics and technical investigation. Here we also used those approaches as well as historical research which is the basis of our visual mosaic. While much of the research behind Calculating Empires was based in traditional archival work with books, scientific papers and online resources, we augmented that with more technical and data collection techniques.
Our work is based on a non-linear, spatial form of narrative. There is a rigorous structure within them, based in our own idiosyncratic logic, but they remain open to multiple readings. The visual language of Calculating Empires is a continuation of the style and language of some of our previous works. Within the map, we have a constant flow of individual taxonomies and information points; abstract visual representations in the form of illustration and diagrammatic forms; and hundreds of specific texts.
Each observer of the map will understand it in their own way, interpret its content in accordance with his social and cultural experience. Those maps are not finished sentences, but an opening to a dialogue with its observers.
Calculating Empires illustrates the past in order to inform the present. It is designed as a seductive visual journey that invites you in, then asks you to question the role of technological spectacle. It aims to engage audiences by connecting interdisciplinary research with informative and provocative imagery about how technology and social systems coevolve.
Given the scale and detail of the installation, what are some key takeaways or focal points you hope viewers will remember?
Kate Crawford: Calculating Empires is at once an immersive work, a tool to understand the existing state of technology and power, and a way to explore 500 years of history in order to make your own connections and stories. It invites viewers to see the politics threaded throughout what we use every day, and the way that the imperial powers that drove colonization in the 16th and 17th centuries are reflected in the centralization of power in technology companies today.
As researchers, we’re frustrated by most tech discourse, which is chasing the latest AI models and corporate moves. It creates a short-sightedness about the larger movements of enclosure and the extreme concentration of power and wealth. We hope that viewers will come away from this work seeing the present in new ways – and collectively imagine how different futures could be realized. And hopefully it engenders a sense of urgency about the need for political engagement in our world – it’s the only way to change the underlying dynamics that are centralizing power, increasing militarization, and intensifying the climate crisis.
In what ways do you think art and visual narratives can contribute to a deeper understanding of technological and political histories?
Vladan Joler: If we take the longer view, the history of science and technology is also a story of visualizations. From the Venn diagram to the neural network, visual illustrations have shaped the conceptual horizons of the scientific imaginary. We use the same method to show how technology is political, not separate from it. Even diagrammatic representations – from the Gannt chart to the logic gate – are forms of organizing information which embed a political structure.
Calculating Empires takes Donna Haraway’s provocation literally that we need to map the “informatics of domination.” The technologies of today are the latest manifestations of a long line of entangled systems of knowledge and control. This is the purpose of our visual genealogy: to show the complex interplay of systems of power, information, and circumstance across terrain and time, in order to imagine how things could be otherwise.
How do you think future technological developments might continue to reflect or diverge from the patterns you’ve traced in “Calculating Empires”?
Kate Crawford: Planetary infrastructures take enormous amounts of time and capital to build. We are interested in tracking these slow moving structures. In the words of French historian Fernand Braudel, “if one wants to understand the world, one has to determine the hierarchy of forces, currents, and individual movements, and then put them together to form an overall constellation. Throughout, one must distinguish between long-term movements, and momentary pressures, finding the immediate sources of the latter and the long-term thrust of the former.” Calculating Empires is our account of where we see the long-term movements and the contemporary pressures – and placing them in a large constellation so people can make their own predictions and – hopefully – interventions!
Find out more about S+T+ARTS here.

Kate Crawford
Prof. Kate Crawford (US) is a leading scholar of the impacts of artificial intelligence. She is a professor at USC in Los Angeles, a senior principal researcher at MSR New York, and the inaugural chair of AI and Justice at the École Normale Supérieure. Her book Atlas of AI won multiple awards, was named a book of the year by Science and the Financial Times, and is translated into 12 languages. She leads the Knowing Machines project, an international research collaboration on the foundations of AI. Her artworks have been acquired by museums such as MoMA and the V&A, and received the Aryton Prize. Kate was named by TIME magazine’s TIME100 as one of the most influential people in AI.
Vladan Joler
Prof. Dr. Vladan Joler (RS) is an academic, researcher, and artist whose work blends data investigations, critical cartography, investigative journalism, and data visualization. He is SHARE Foundation co-founder and professor at the New Media Department of the University of Novi Sad. Vladan Joler’s work is in the permanent collections of the Museum of Modern Art (MoMA), the V&A Museum, and the Design Museum in London, and also in the permanent exhibition of the Ars Electronica Center. His work has been exhibited in more than a hundred international exhibitions worldwide.