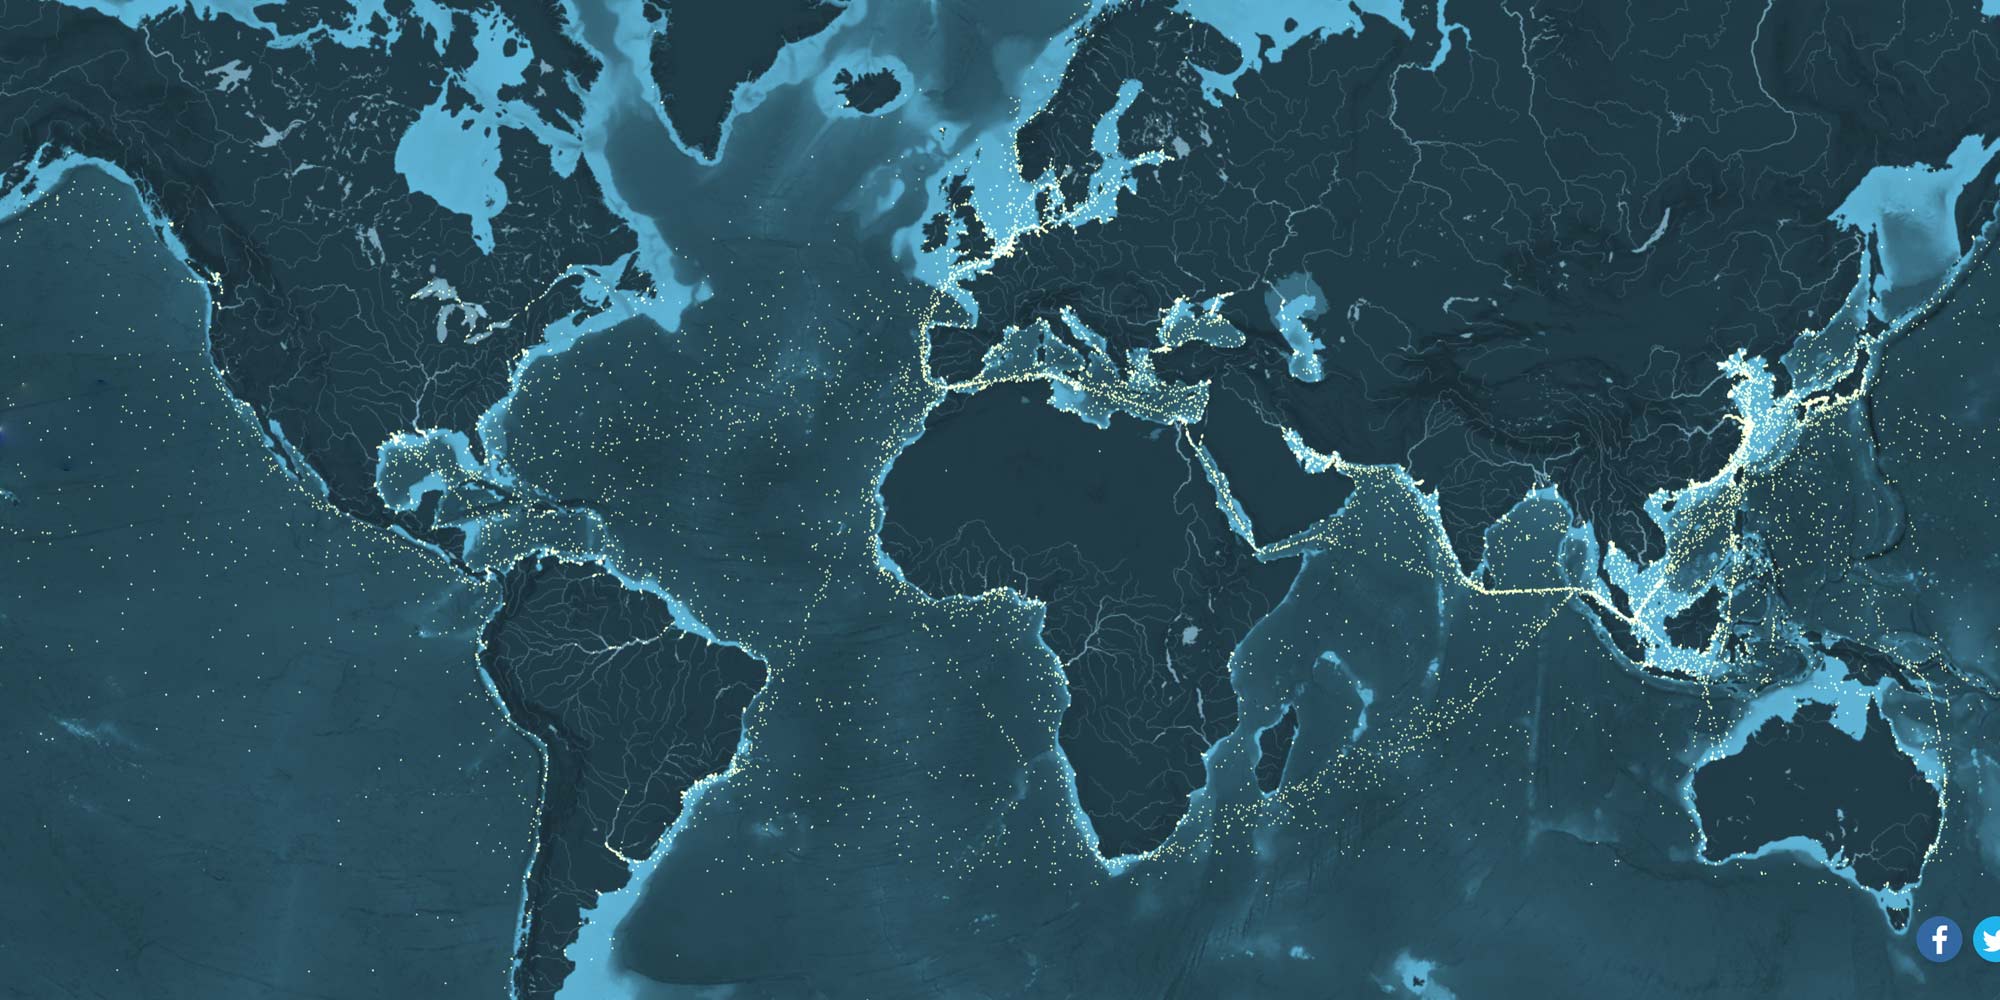
The Shipmap shows the worldwide movements of cargo vessels during the year 2012.
It also displays statistics such as the CO2 emissions caused by shipping traffic (in thousands of tons) and the total freight carried by the ships according to categories (containers, dry bulk, liquids, gas, and vehicles). You can navigate the map as usual; the bottom edge of the screen allows you to select different points in time along the axis. The control panel in the upper right hand corner allows you to add and remove specific levels of the map, such as names of ports, background map, routes, or ships according to freight category.
The map was created by Kiln based on data from the UCL Energy Institute (UCL EI)
Website: Duncan Clark & Robin Houston from Kiln
Data: Julia Schaumeier & Tristan Smith from the UCL EI
Music: Bach Goldberg Variations played by Kimiko Ishizaka