heartbeat

What We Eat
Laurie Frick (US)
As part of Heartbeat of the Earth, a series of online interactive artworks interpreting climate data, data artist Laurie Frick’s work examines the impact of individual foods on the environment using hand-drawn data visualisations, color coded and sized by CO2 output.
Coastline Paradox
Timo Aho (FI) & Pekka Niittyvirta (FI)
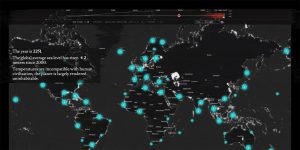
As part of Heartbeat of the Earth a series of online interactive artworks interpreting climate data, using Google Maps and Street View, artists Pekka Niittyvirta and Timo Aho visualize the predicted sea level rise – and the number of people likely to be displaced – in more than 200 different locations between the years 2000 and 2300.

Timelines
Fabian Oefner (CH)
As part of Heartbeat of the Earth, a series of online interactive artworks interpreting climate data, artist Fabian Oefner explores the retreat of the Rhone and Trift glaciers in Switzerland over the last 140 years by using precise digital coordinates and special drone captures.

Diving into an Acidifying Ocean
Cristina Tarquini (IT/FR)
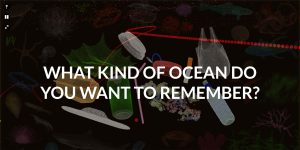
As part of Heartbeat of the Earth, a series of online interactive artworks interpreting climate data, digital artist Cristina Tarquini invites us to dive into our acidifying oceans using data from NOAA. Cristina Tarquini (IT) created an interactive data visualisation, inviting you to dive into the ocean and explore the impact of rising temperatures & in turn rising CO2 levels on marine life, over time.
Diving into an Acidifying Ocean – Q&A
Cristina Tarquini (IT/FR), Frédéric Gazeau (FR) & Freya Murray (UK)
Join the Q&A with the artist who created the online experiment and the scientist who advised her.